2025 ART Price Prediction: Exploring the Future Potential of Artificial Reality Tokens in the Metaverse Economy
Introduction: ART's Market Position and Investment Value
LiveArt (ART), as an AI-powered RWAfi protocol unlocking the $10T market of investment-grade art and collectibles, has achieved significant milestones since its inception. As of 2025, ART's market capitalization has reached $493,480, with a circulating supply of approximately 130,000,000 tokens, and a price hovering around $0.003796. This asset, hailed as the "cultural wealth tokenizer," is playing an increasingly crucial role in transforming blue-chip assets into liquid, programmable financial instruments.
This article will comprehensively analyze ART's price trends from 2025 to 2030, combining historical patterns, market supply and demand, ecosystem development, and macroeconomic factors to provide investors with professional price predictions and practical investment strategies.
I. ART Price History Review and Current Market Status
ART Historical Price Evolution Trajectory
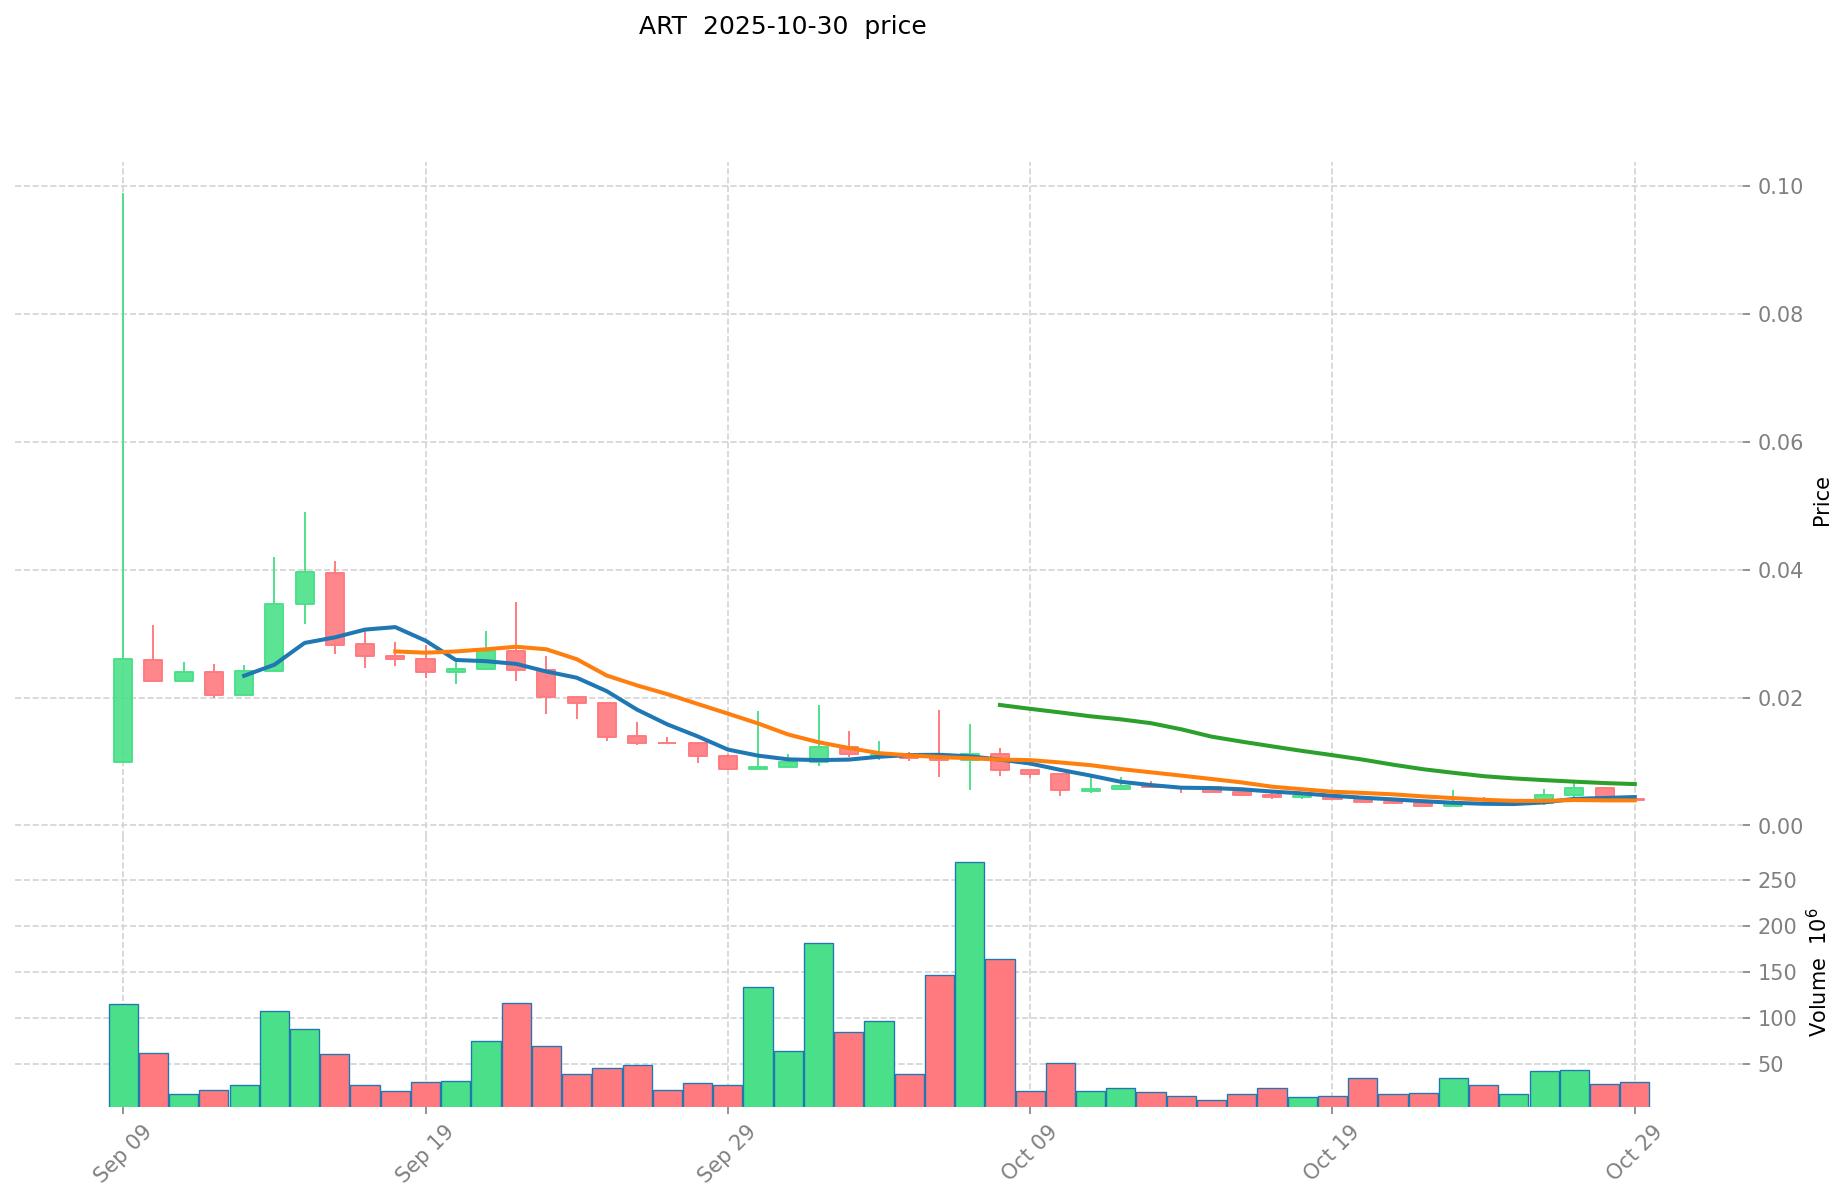
- 2025 September: ART reached its all-time high of $0.099, marking a significant milestone for the project.
- 2025 October: The market experienced a sharp downturn, with ART price dropping to its all-time low of $0.003002.
ART Current Market Situation
As of October 30, 2025, ART is trading at $0.003796, representing a 96.17% decrease from its all-time high. The token has seen a 24-hour trading volume of $105,961.63, with a market capitalization of $493,480. ART's current price indicates a 9.08% decrease in the last 24 hours, suggesting a bearish short-term trend. However, the 7-day performance shows a 4.95% increase, hinting at some potential recovery. The 30-day trend remains strongly negative at -58.98%, reflecting significant selling pressure over the past month. With a circulating supply of 130,000,000 ART tokens out of a total supply of 1,000,000,000, the current market represents only 13% of the total potential supply.
Click to view the current ART market price
ART Market Sentiment Indicator
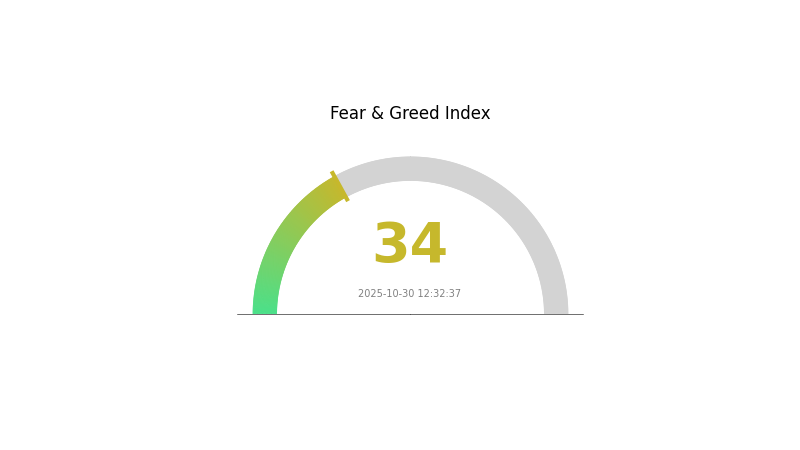
2025-10-30 Fear and Greed Index: 34 (Fear)
Click to view the current Fear & Greed Index
The crypto market sentiment remains cautious, with the Fear and Greed Index at 34, indicating a fearful outlook. This suggests investors are hesitant and risk-averse. During such periods, some see opportunities for potential bargains, while others remain wary of further market declines. It's crucial for traders to stay informed, manage risks carefully, and consider long-term strategies. Remember, market sentiment can shift quickly, so stay vigilant and make informed decisions based on thorough research and analysis.
ART Holdings Distribution
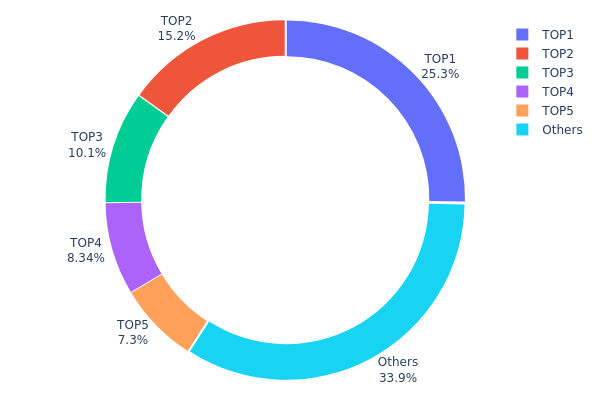
The address holdings distribution data for ART reveals a significant concentration of tokens among a small number of addresses. The top address holds 25.25% of the total supply, while the top five addresses collectively control 66.13% of ART tokens. This high level of concentration indicates a potentially centralized ownership structure.
Such concentration raises concerns about market stability and vulnerability to price manipulation. With a single address holding over a quarter of the supply, there's a risk of large sell-offs causing significant price volatility. Moreover, the top five addresses having the ability to influence more than two-thirds of the token supply could potentially coordinate actions that impact the broader market.
This distribution pattern suggests a low level of decentralization for ART, which may affect its long-term sustainability and adoption. While some concentration is common in early-stage projects, this level of centralization could deter potential investors concerned about equitable token distribution and market fairness.
Click to view the current ART Holdings Distribution
| Top | Address | Holding Qty | Holding (%) |
|---|---|---|---|
| 1 | 0xbe58...6e389e | 250000.00K | 25.25% |
| 2 | 0x61bf...789694 | 150000.00K | 15.15% |
| 3 | 0x19f7...6b7ea1 | 100000.00K | 10.10% |
| 4 | 0x9135...6490ed | 82551.71K | 8.33% |
| 5 | 0x3832...7c1559 | 72282.53K | 7.30% |
| - | Others | 335164.35K | 33.87% |
II. Key Factors Influencing ART's Future Price
Supply Mechanism
- Token Burning: As more assets are tokenized and traded on the secondary market, ART's scarcity is expected to increase.
- Staking Mechanism: The deepening of staking and lock-up mechanisms may further reduce circulating supply.
- Current Impact: The increasing scarcity and utility of ART due to these mechanisms are anticipated to drive price appreciation.
Macroeconomic Environment
- Monetary Policy Impact: The Federal Reserve is expected to continue its rate-cutting cycle in 2025, potentially weakening the US dollar and boosting alternative assets like ART.
- Inflation Hedging Properties: In an inflationary environment, ART may attract investors seeking to preserve value.
Technical Development and Ecosystem Building
- Asset Tokenization: Continued development of the ecosystem and tokenization of more assets are expected to increase ART's utility.
- Ecosystem Applications: Growth in secondary market trading of tokenized assets may boost demand for ART.
III. ART Price Prediction for 2025-2030
2025 Outlook
- Conservative prediction: $0.00308 - $0.00350
- Neutral prediction: $0.00350 - $0.00380
- Optimistic prediction: $0.00380 - $0.00418 (requires positive market sentiment)
2027-2028 Outlook
- Market phase expectation: Potential growth phase
- Price range forecast:
- 2027: $0.00325 - $0.00494
- 2028: $0.00391 - $0.00531
- Key catalysts: Increased adoption, market recovery, project developments
2029-2030 Long-term Outlook
- Base scenario: $0.00507 - $0.00530 (assuming steady market growth)
- Optimistic scenario: $0.00552 - $0.00582 (assuming strong market performance)
- Transformative scenario: $0.00600+ (under extremely favorable conditions)
- 2030-12-31: ART $0.00582 (potential peak price)
| 年份 | 预测最高价 | 预测平均价格 | 预测最低价 | 涨跌幅 |
|---|---|---|---|---|
| 2025 | 0.00418 | 0.0038 | 0.00308 | 0 |
| 2026 | 0.00543 | 0.00399 | 0.00283 | 5 |
| 2027 | 0.00494 | 0.00471 | 0.00325 | 24 |
| 2028 | 0.00531 | 0.00483 | 0.00391 | 27 |
| 2029 | 0.00552 | 0.00507 | 0.0035 | 33 |
| 2030 | 0.00582 | 0.0053 | 0.00487 | 39 |
IV. Professional Investment Strategies and Risk Management for ART
ART Investment Methodology
(1) Long-term Holding Strategy
- Suitable for: Investors interested in the RWAfi sector and art market
- Operational advice:
- Accumulate ART tokens during market dips
- Stay informed about LiveArt's partnerships and platform developments
- Store tokens in a secure non-custodial wallet
(2) Active Trading Strategy
- Technical analysis tools:
- Moving Averages: Use to identify trends and potential entry/exit points
- Relative Strength Index (RSI): Helps gauge overbought/oversold conditions
- Key points for swing trading:
- Monitor trading volume for potential breakouts
- Set stop-loss orders to manage downside risk
ART Risk Management Framework
(1) Asset Allocation Principles
- Conservative investors: 1-3% of crypto portfolio
- Moderate investors: 3-5% of crypto portfolio
- Aggressive investors: 5-10% of crypto portfolio
(2) Risk Hedging Solutions
- Diversification: Balance ART with other crypto assets and traditional investments
- Stop-loss orders: Implement to limit potential losses
(3) Secure Storage Solutions
- Hot wallet recommendation: Gate Web3 Wallet
- Cold storage solution: Hardware wallet for long-term holdings
- Security precautions: Enable two-factor authentication, use strong passwords
V. Potential Risks and Challenges for ART
ART Market Risks
- Price volatility: ART may experience significant price swings
- Liquidity risk: Limited trading volume may affect ability to enter/exit positions
- Market sentiment: Changes in crypto or art market sentiment could impact ART's value
ART Regulatory Risks
- Regulatory uncertainty: Evolving regulations may affect RWAfi tokens
- Cross-border compliance: International regulations may impact global accessibility
- Tax implications: Unclear tax treatment of RWAfi tokens in various jurisdictions
ART Technical Risks
- Smart contract vulnerabilities: Potential for exploits or bugs in the token contract
- Blockchain congestion: Network issues on Base could affect transaction speed
- Integration challenges: Risks associated with connecting real-world assets to blockchain
VI. Conclusion and Action Recommendations
ART Investment Value Assessment
ART offers exposure to the growing RWAfi sector and art market tokenization. Long-term potential exists as the platform expands, but short-term volatility and regulatory uncertainties pose significant risks.
ART Investment Recommendations
✅ Beginners: Consider small, long-term positions after thorough research ✅ Experienced investors: Implement dollar-cost averaging strategy with strict risk management ✅ Institutional investors: Conduct comprehensive due diligence and consider as part of a diversified crypto portfolio
ART Trading Participation Methods
- Spot trading: Buy and sell ART tokens on Gate.com
- Limit orders: Set specific entry and exit prices to manage risk
- Staking: Participate in any available staking programs to earn passive income (if offered)
Cryptocurrency investments carry extremely high risk. This article does not constitute investment advice. Investors should make decisions carefully based on their own risk tolerance and are advised to consult professional financial advisors. Never invest more than you can afford to lose.
FAQ
What crypto has the highest price prediction?
As of 2025, Ethereum has the highest price prediction among major cryptocurrencies, based on technological advancements and market trends.
Will the graph reach $10?
Based on current trends and expert analysis, The Graph (GRT) is unlikely to reach $10 by 2025. However, future price movements will depend on adoption rates and market conditions.
How much will Fetch AI be worth in 2030?
Based on current market analysis, Fetch AI is projected to reach $16.23 by 2030. This forecast is speculative and subject to market conditions.
What is the price prediction for live art?
The price prediction for LiveArt in 2026 is estimated at $0.01, based on a projected 5% price change. Market conditions may affect this forecast.
Share
Content
Introduction: ART's Market Position and Investment Value
I. ART Price History Review and Current Market Status
II. Key Factors Influencing ART's Future Price
III. ART Price Prediction for 2025-2030
IV. Professional Investment Strategies and Risk Management for ART
V. Potential Risks and Challenges for ART
VI. Conclusion and Action Recommendations
FAQ

